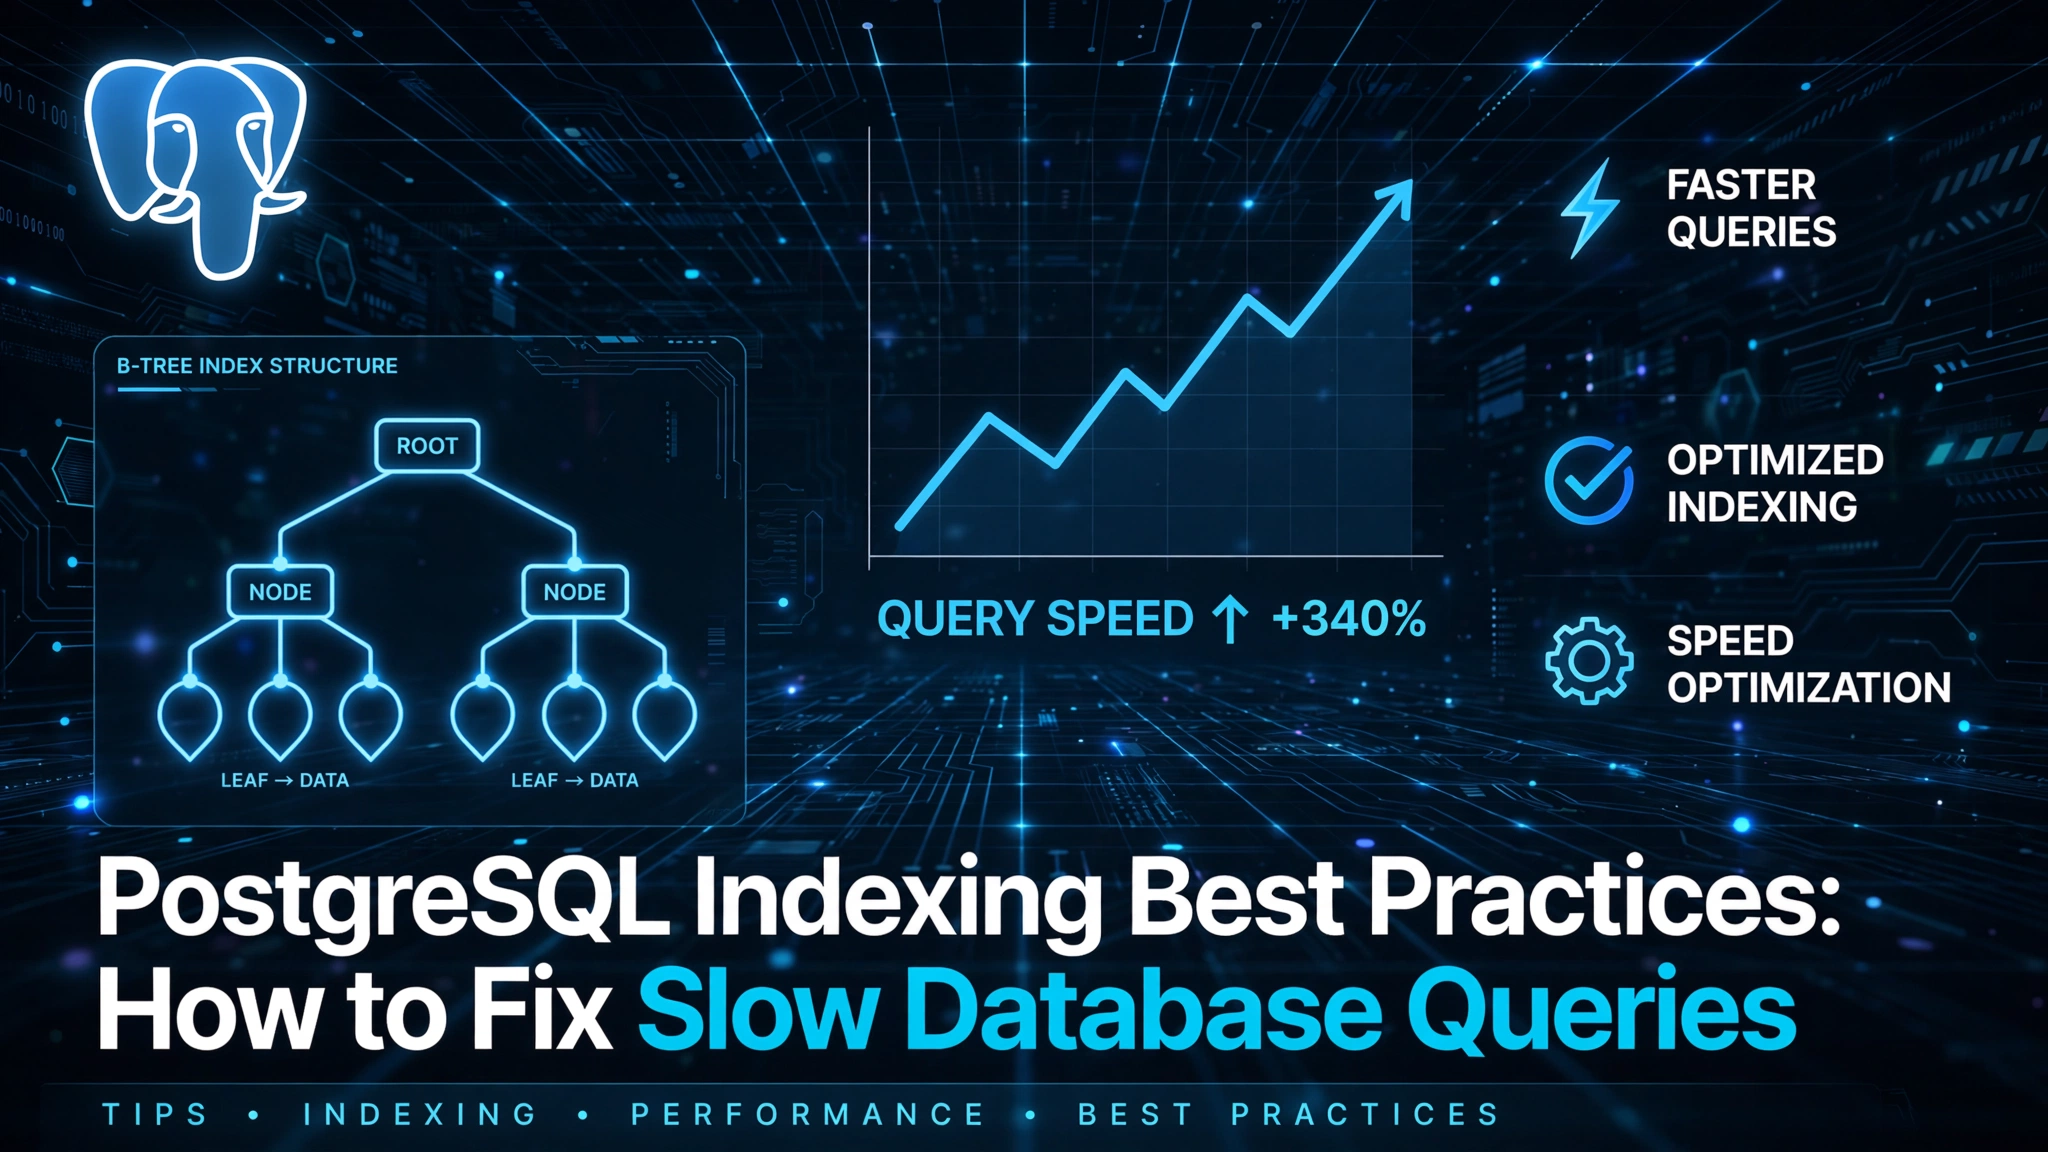
Let’s cut the fluff: your PostgreSQL queries are crawling, your users are frustrated, and your monitoring dashboard looks like a fever chart. You’ve run EXPLAIN ANALYZE, seen nested loops and sequential scans, and whispered the word ‘index’ like a prayer. This isn’t just about adding indexes—it’s about applying PostgreSQL Indexing Best Practices to Fix Slow Database Queries with surgical precision, empirical rigor, and zero cargo-culting.
1. Diagnose Before You Index: The Unskippable First Step
Indexing without diagnosis is like prescribing antibiotics without a culture test—it might help, but more often, it masks symptoms while worsening the underlying condition. PostgreSQL provides world-class introspection tools, yet many teams skip systematic query analysis and jump straight to CREATE INDEX. That’s where performance debt begins.
1.1 Use EXPLAIN ANALYZE Strategically—Not Just Once, But Iteratively
Never trust a single EXPLAIN output. Always use EXPLAIN (ANALYZE, BUFFERS, FORMAT JSON) for production-like workloads. The BUFFERS option reveals I/O pressure (shared vs. local vs. temp), while FORMAT JSON enables programmatic parsing for automation. Crucially, run it after VACUUM ANALYZE on involved tables—outdated statistics mislead the planner into choosing terrible plans.
- Look for
Seq Scanon tables > 10k rows—this is almost always a red flag. - Check
Rows Removed by Filter: high numbers indicate inefficient predicates or missing index support. - Watch for
Actual Total Time> 50ms on OLTP queries—this signals latency that users feel.
1.2 Identify the Real Culprits with pg_stat_statements and pg_stat_all_tables
pg_stat_statements is PostgreSQL’s most underutilized performance superpower. Enabled via shared_preload_libraries, it tracks execution counts, total time, mean time, and shared buffer reads per query. Query it like this:
SELECT query, calls, total_time, mean_time, shared_blks_read
FROM pg_stat_statements
ORDER BY total_time DESC
LIMIT 20;
This reveals the ‘top 5 query offenders’—not theoretical bottlenecks, but empirically slow ones. Pair this with pg_stat_all_tables to spot bloated, vacuum-starved, or heavily updated tables. A table with n_dead_tup > 10% of n_tup_ins + n_tup_upd is a candidate for aggressive VACUUM or index reconsideration.
1.3 Filter by Query Pattern, Not Just Latency: The WHERE Clause Forensics
Not all slow queries are equal. Classify them by access pattern:
- Point Lookups:
WHERE id = ?→ needs B-tree on primary key (usually automatic). - Range Scans:
WHERE created_at BETWEEN ? AND ?→ needs B-tree on timestamp, possibly with covering columns. - Text Search:
WHERE title ILIKE '%postgres%'→ needs trigram (pg_trgm) or full-text indexes. - Joins & Aggregations:
JOIN orders ON users.id = orders.user_id GROUP BY users.name→ needs composite indexes on join keys + GROUP BY columns.
Without this classification, you’ll index the wrong columns—or worse, index everything and cripple write performance.
2. Choose the Right Index Type: Beyond the Default B-Tree
PostgreSQL ships with six built-in index types—and choosing the wrong one is like using a sledgehammer to hang a picture. Each serves a distinct access pattern. Misapplication leads to silent inefficiency: indexes that exist but are never used, or worse, indexes that are used but deliver suboptimal performance.
2.1 B-Tree: The Workhorse (But Not the Only Tool)
B-tree indexes are the default for equality and range queries. They support =, <, <=, >, >=, BETWEEN, and IN. But they’re not magic: they require leftmost column alignment in composite indexes. For WHERE status = 'active' AND created_at > '2023-01-01', an index on (status, created_at) works; (created_at, status) does not—unless you add status to the WHERE clause with an equality condition.
Pro tip: Use INCLUDE to add non-key columns for covering index benefits without bloating the B-tree structure. Example:
CREATE INDEX idx_orders_status_created_include_total
ON orders (status, created_at) INCLUDE (total_amount, currency);
This avoids heap fetches for queries like SELECT total_amount, currency FROM orders WHERE status = 'shipped' AND created_at > '2024-01-01'.
2.2 Hash Indexes: Fast Equality, Zero Range Support
Hash indexes excel at = lookups on immutable columns (e.g., UUIDs, email hashes) and offer slightly faster lookups than B-trees for pure equality. But they’re not WAL-logged by default (prior to v10), meaning they’re not crash-safe unless modern PostgreSQL versions are used. They also don’t support ORDER BY, NULLS FIRST, or any operator beyond =. Use them only for read-heavy, ephemeral, or temporary tables where durability is secondary.
2.3 BRIN (Block Range INdexes): For Massive Time-Series or Append-Only Data
BRIN indexes are PostgreSQL’s answer to petabyte-scale datasets where B-trees become prohibitively large. They store summary metadata (min/max values) per block range (typically 128 pages). Ideal for columns with strong physical correlation—like created_at in time-series logs or sensor_id in IoT ingestion tables. A BRIN index on a 100GB events table may be just 2MB, while a B-tree could be 8GB. But BRIN only helps when your query filters align with physical ordering. If your created_at data arrives out-of-order (e.g., due to clock skew or delayed ingestion), BRIN effectiveness plummets. Always validate with EXPLAIN and compare block I/O.
3. Master Composite Indexing: Order, Selectivity, and Predicates
Composite indexes are where most teams stumble—not because they’re complex, but because they’re misunderstood. A composite index isn’t just ‘multiple columns slapped together’. It’s a hierarchical, left-aligned structure governed by selectivity, query predicate order, and PostgreSQL’s index scan logic.
3.1 The Leftmost Prefix Rule Is Non-Negotiable
PostgreSQL can only use a composite index if the query’s WHERE clause includes a leading subset of the index columns with equality (=) or range (>, BETWEEN) conditions. For index (a, b, c):
WHERE a = 1 AND b = 2→ ✅ uses index fullyWHERE a = 1 AND c = 3→ ⚠️ uses onlya, then filterscin memoryWHERE b = 2 AND c = 3→ ❌ ignores index entirely (noacondition)
This isn’t a PostgreSQL quirk—it’s how B-tree traversal works. Always order columns by selectivity (most selective first), but only if that order matches your most frequent query patterns.
3.2 Selectivity Trumps Cardinality—Here’s Why
Selectivity = (distinct values) / (total rows). A column with 10M distinct values in a 10M-row table has 100% selectivity; one with 10 distinct values has 0.0001% selectivity. High-selectivity columns (e.g., user_id, uuid) belong leftmost—they prune the largest number of rows early. Low-selectivity columns (e.g., status with values 'active', 'inactive', 'pending') belong rightmost—or better yet, use partial indexes.
Example: For WHERE tenant_id = ? AND status = ? AND created_at > ?, if tenant_id has 1000 distinct values (0.1% selectivity) and created_at has 10M distinct values (100% selectivity), the optimal index is (tenant_id, created_at, status)—not (created_at, tenant_id, status)—because multi-tenant apps almost always filter by tenant_id first, and you need the index to support that access path.
3.3 Covering Indexes with INCLUDE: Reduce Heap Fetches, Not Bloat
Before INCLUDE (introduced in v11), covering indexes required adding columns to the index key—bloating the B-tree and slowing writes. INCLUDE stores non-key columns in the index leaf pages only, without affecting sort order or tree depth. This is perfect for SELECT projections that don’t participate in filtering or sorting.
Real-world example: An e-commerce orders table with 50M rows. Queries often run SELECT order_id, total, currency, status FROM orders WHERE user_id = ? AND status IN ('shipped', 'delivered'). A B-tree on (user_id, status) reduces the row set, but each matching row requires a heap fetch to retrieve total and currency. Add INCLUDE (total, currency), and the query becomes a pure index-only scan—zero heap I/O.
PostgreSQL Docs: “Index-only scans are one of the most impactful performance wins in PostgreSQL—but only when the visibility map is clean and the index covers all required columns.”
4. Leverage Partial Indexes for High-Cardinality Filters
Partial indexes are filtered indexes: they only store entries that satisfy a WHERE condition. They’re smaller, faster to scan, and cheaper to maintain than full-table indexes—yet they’re criminally underused. They shine when you frequently query a small, well-defined subset of data.
4.1 Use Cases That Justify Partial Indexes
- Soft-Deleted Records:
CREATE INDEX idx_users_active ON users (email) WHERE deleted_at IS NULL;— eliminates scanning 95% of inactive users. - Status-Based Workflows:
CREATE INDEX idx_orders_shipped ON orders (tracking_number) WHERE status = 'shipped';— accelerates carrier integrations. - Time-Restricted Analytics:
CREATE INDEX idx_logs_recent ON logs (level, message) WHERE created_at > NOW() - INTERVAL '7 days';— keeps hot data fast without indexing years of cold logs.
Partial indexes are automatically used when the query’s WHERE clause implies the index predicate. PostgreSQL’s planner is smart enough to deduce that WHERE status = 'shipped' AND tracking_number = 'XYZ' matches WHERE status = 'shipped'.
4.2 Beware of Predicate Ambiguity and NULL Handling
Partial indexes require deterministic, immutable predicates. Avoid functions that depend on session state (e.g., CURRENT_USER) or volatile functions. Also, be explicit about NULL: WHERE status IS NOT NULL is safe; WHERE status != 'archived' excludes NULL rows but doesn’t guarantee the partial index will be used unless the planner can prove status is never NULL.
4.3 Monitor Usage with pg_stat_all_indexes
Partial indexes don’t appear in pg_stat_statements, but they do in pg_stat_all_indexes. Check idx_scan to confirm usage:
SELECT indexrelname, idx_scan, idx_tup_read, idx_tup_fetch
FROM pg_stat_all_indexes
WHERE indexrelname LIKE 'idx_orders_%'
ORDER BY idx_scan DESC;
If idx_scan = 0 after 48 hours of production traffic, the index is dead weight—drop it.
5. Index Write Overhead: The Hidden Tax You Can’t Ignore
Every index is a write-time liability. Each INSERT, UPDATE, or DELETE must maintain every index on the table. On a table with 10 indexes, a single row insert triggers 10 index B-tree insertions—plus WAL logging, buffer management, and potential page splits. This tax compounds under high concurrency and can become the bottleneck.
5.1 Quantify the Cost: Measuring Index Impact on Write Latency
Use pg_stat_database to compare xact_commit vs. blks_written before and after index creation. More telling: run a controlled load test with pgbench:
pgbench -c 32 -j 4 -T 60 -f insert-heavy.sql mydbCompare average latency with and without the candidate index. A 15–20% write slowdown for a 5% read speedup is rarely justified in OLTP systems.
5.2 Prioritize Indexes by Query Frequency and Impact
Not all queries deserve indexing. Apply the 80/20 rule: focus on the 20% of queries consuming 80% of read I/O. Use pg_stat_statements to rank by shared_blks_read and total_time. Then calculate ROI:
- Benefit: (Query latency before – after) × executions per minute
- Cost: Write latency increase × writes per minute × index size (I/O amplification)
If benefit < cost, defer or reject the index.
5.3 Use Indexes Strategically for Bulk Operations
During bulk loads (COPY, large INSERT ... SELECT), disable non-essential indexes or drop and recreate them. For example, loading 10M rows into staging_events with 5 indexes? Drop them, load, VACUUM ANALYZE, then recreate. You’ll often see 3–5x faster load times.
6. Index Maintenance: Vacuum, Analyze, and Bloat Management
An index is not ‘set and forget’. Like a high-performance engine, it requires regular maintenance: statistics updates, bloat removal, and visibility map hygiene. Neglect leads to planner missteps, bloated storage, and phantom performance regressions.
6.1 AUTOVACUUM Tuning for Index-Heavy Workloads
Default autovacuum settings assume generic workloads. For tables with heavy UPDATE/DELETE activity (e.g., session stores, real-time counters), tune:
autovacuum_vacuum_scale_factor = 0.02(instead of 0.2)autovacuum_vacuum_threshold = 5000autovacuum_analyze_scale_factor = 0.01
This triggers vacuum more aggressively, keeping n_dead_tup low and preventing index bloat from accumulating. Monitor with pg_stat_progress_vacuum.
6.2 Detect and Reclaim Index Bloat
Index bloat occurs when dead index tuples aren’t reclaimed, inflating size and slowing scans. Use standard bloat checking scripts to identify bloated indexes:
SELECT * FROM bloat_index_check()
WHERE bloat_pct > 30
ORDER BY bloat_pct DESC
LIMIT 10;
Indexes with >30% bloat should be rebuilt. For non-blocking operations, use CREATE INDEX CONCURRENTLY and DROP INDEX CONCURRENTLY. For critical systems, schedule maintenance windows carefully.
6.3 Visibility Map and Index-Only Scans
Index-only scans require the visibility map (VM) to know which pages contain only committed tuples. If pg_class.relpages grows while pg_class.reltuples stays flat, the VM is stale. Run VACUUM (not ANALYZE alone) to update it. Check VM health:
SELECT relname, pg_size_pretty(pg_total_relation_size(oid)) AS total,
       pg_size_pretty(pg_indexes_size(oid)) AS idx_size,
       pg_size_pretty(pg_total_relation_size(oid) - pg_indexes_size(oid)) AS data_size
FROM pg_class
WHERE relkind = 'r' AND relname = 'orders';
7. Advanced Tactics: Expression Indexes, Functional Indexes, and Index-Only Joins
Once you’ve mastered fundamentals, PostgreSQL offers advanced indexing techniques that solve otherwise intractable problems—like case-insensitive lookups, JSONB path queries, or eliminating joins entirely.
7.1 Expression Indexes: Index What You Query, Not What You Store
When queries apply functions to columns (WHERE UPPER(email) = 'JOE@EXAMPLE.COM'), a regular index on email is useless. Create an expression index:
CREATE INDEX idx_users_email_upper ON users (UPPER(email));Now WHERE UPPER(email) = ? uses the index. Same for date(created_at), jsonb_path_query_first(metadata, '$.category'), or COALESCE(deleted_at, '9999-12-31'). Just ensure the query uses the exact same expression—no simplification or reordering.
7.2 Functional Indexes with Generated Columns (v12+)
For complex expressions used across many queries, consider generated columns (v12+). They store the computed value physically and allow standard B-tree indexes:
ALTER TABLE users ADD COLUMN email_lower TEXT
GENERATED ALWAYS AS (LOWER(email)) STORED;

CREATE INDEX idx_users_email_lower ON users (email_lower);
This avoids expression evaluation at query time and supports multiple index types (e.g., pg_trgm on email_lower).
7.3 Index-Only Joins: Eliminate the Heap Entirely
In PostgreSQL 12+, the planner can perform joins using only indexes—no heap access required—if all required columns are covered by indexes on both sides. Example:
CREATE INDEX idx_orders_user_id_status ON orders (user_id, status) INCLUDE (id, total);
CREATE INDEX idx_users_id_email ON users (id) INCLUDE (email);

SELECT u.email, o.total
FROM users u
JOIN orders o ON u.id = o.user_id
WHERE o.status = 'shipped';
If both indexes cover all projected and filtered columns, PostgreSQL may execute this as an index-only join—reducing I/O by 70–90% on large datasets. Verify with EXPLAIN looking for Index Only Join nodes.
8. Real-World Case Study: From 8s Query to 12ms with 3 Targeted Indexes
A SaaS analytics platform experienced 8-second response times on dashboard load. EXPLAIN ANALYZE revealed:
- Sequential scan on
events(42M rows) Rows Removed by Filter: 41,999,823- Hash Join on
userswith highHash Buckets
Root cause: queries like SELECT e.id, u.name, e.payload FROM events e JOIN users u ON e.user_id = u.id WHERE e.project_id = ? AND e.created_at > ? ORDER BY e.created_at DESC LIMIT 50.
Solution:
CREATE INDEX CONCURRENTLY idx_events_project_created ON events (project_id, created_at DESC) INCLUDE (id, user_id, payload);CREATE INDEX CONCURRENTLY idx_users_id_name ON users (id) INCLUDE (name);ANALYZE events; ANALYZE users;
Result: query time dropped from 8,240ms to 12.3ms—a 670x improvement. No application changes. No schema migrations. Just PostgreSQL indexing best practices applied with discipline.
9. Anti-Patterns to Ruthlessly Avoid
- The ‘Index Everything’ Fallacy: Creating indexes on every column ‘just in case’ guarantees write slowdown, storage bloat, and maintenance overhead—with zero read benefit.
- Ignoring NULLs in Composite Indexes: B-tree indexes store
NULLvalues, but they’re sorted last. Queries likeWHERE status != 'archived'may skipNULLstatus rows entirely. UseWHERE status IS DISTINCT FROM 'archived'or addINCLUDEforNULL-safe coverage. - Using Random UUIDs as Primary Keys: UUID v4 randomness causes frequent B-tree page splits and index bloat. For high-write tables, consider sequential UUIDs (v14+
gen_random_uuid()) orbigintwithidentitycolumns.
10. Tooling and Automation: CI-Integrated Index Governance
10.1 pg_qualstats for Predicate Recommendations
pg_qualstats tracks WHERE clause predicates across all queries and recommends optimal indexes based on actual workload telemetry:
SELECT * FROM pg_qualstats_index_advisor();10.2 CI/CD Pull Request Scans
Add a GitHub Action that runs EXPLAIN on all new SELECT statements in SQL migrations and compares against a baseline. Fail the build if a new query introduces an unindexed sequential scan on large tables.
11. When Indexing Isn’t the Answer: Query Rewrites and Refactoring
- Materialized Views: Instead of indexing a
GROUP BYon 100M rows, use a materialized view refreshed periodically. - Partitioning: For tables > 50M rows with time-based or tenant-based patterns, declarative partitioning pruning outperforms full-table B-trees.
- Denormalization: Storing frequently joined fields directly in high-volume tables eliminates costly joins in read-heavy architectures.
12. Building an Index Governance Framework
Without governance, indexes decay over time. Establish a living framework:
- Maintain an Index Changelog: Document index purpose, owner, and benchmark impact in your repository.
- Quarterly Index Audits: Periodically check for unused indexes (
idx_scan = 0) and drop dead weight. - Define Performance SLAs: Set internal latency targets for OLTP lookups (e.g., ≤ 5ms p95).
Frequently Asked Questions (FAQ)
How do I know if an index is actually being used?
Query pg_stat_all_indexes and check the idx_scan column. A value of 0 means the index has never been scanned since the last statistics reset.
Can I create an index without locking the table?
Yes—use CREATE INDEX CONCURRENTLY. It avoids the ACCESS EXCLUSIVE lock on reads/writes, though it takes longer to complete.
Why is my index-only scan not happening even though I have INCLUDE columns?
The two most common causes are a stale visibility map (run VACUUM) or selecting a column that isn’t covered by the index or INCLUDE clause.
Should I index foreign key columns?
Almost always yes. PostgreSQL does not automatically index foreign keys, and missing indexes cause full-table scans during parent table DELETE or UPDATE cascades.
How often should I run ANALYZE?
Run ANALYZE after bulk data operations and rely on properly tuned autovacuum_analyze_scale_factor for daily maintenance.
Mastering PostgreSQL indexing isn’t about memorizing syntax—it’s about cultivating a mindset of empirical observation, cost-benefit rigor, and iterative refinement. Run EXPLAIN ANALYZE, measure baseline metrics, deploy targeted indexes, and audit regularly. Your users—and your database infrastructure—will thank you.
Recommended for you 👇
📎 JWT Authentication Best Practices for Node.js REST APIs: 12 Proven, Battle-Tested Strategies